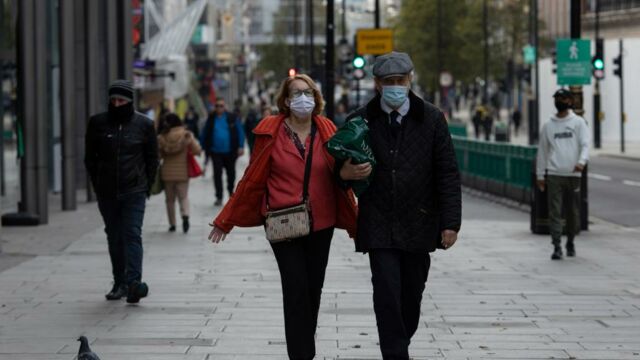
News of a vaccine has recently hit the stands, but despite the jab being 90% per cent effective, we are still far from being out of the woods.
Discover our latest podcast
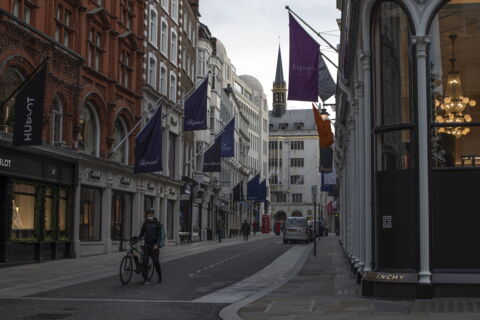
Most recent rolling data of the week to November 5th shows shocking increases of coronavirus cases around England despite the areas being in total lockdown.
Oldham, which was placed into tier three right before the nationwide lockdownhas already seen a sharp increase from 698.8 cases per 100,000 on the week ending October 29th to 773.9 (1835 new cases) on the week ending November 5th.
The new data places the Greater Manchester town as the top of the list as the most affected area in the country.
Data shows that out of 315 areas in England 210 of them have recently seen a worrying increase in coronavirus infections including Hull.
The East Yorkshire town has doubled its cases of coronavirus over the last week going from just 373 cases per 100,000 to 671.3 with 1744 new cases.
Despite the good news of a vaccine rolling out over the new year by Pfizer and their partner BioNTech. Prime Minister Boris Johnson recently addressed the public from Downing Street to warn them that the nation is yet to be over the hurdle. He stated:
These are very very early days. I have talked about the distant bugle of the scientific cavalry coming over the brow of the hill. That toot of that bugle is louder but still some way off. We cannot rely on this news as a solution.
So far data has confirmed Johnson’s thoughts as Blackburn with Darwen has the second-highest rate of infection despite their numbers dropping from the week before. On the week of October 29th, the area had a rate 0f 730.1 per 100,000 which has now gone down slightly to 719.5.
North East Lincolnshire, Scarborough and Amber Valley have also all seen a rather alarming jump in infections over the last week with Amber Valley going from 273.1 to 423.0 cases per 100,000.
Data confirmed on Monday the 9th also showed that the coronavirus death toll has risen by 194 to 49,238, with another 21,350 people testing positive for the virus within the 24 hours from Sunday to Monday.
What about the rest of England?
Recent rolling data shows the rate of infection represented per 100,000 people from most to least infected areas. The first set of data indicates the rate of infection ending on the week of November 5th while the second set shows the data from the previous week ending on October 29th.
The data shown in brackets indicates the actual number of recorded cases in that time.
- Oldham 773.9 (1835), 698.8 (1657)
- Blackburn with Darwen 719.5 (1077), 730.1 (1093)
- Hull 671.3 (1744), 373.0 (969)
- North East Lincolnshire 635.5 (1014), 409.9 (654)
- Rochdale 596.6 (1327), 584.5 (1300)
- Wigan 593.0 (1949), 678.5 (2230)
- Bury 586.9 (1121), 560.2 (1070)
- Bradford 572.1 (3088), 517.3 (2792)
- Salford 563.3 (1458), 632.8 (1638)
- Kirklees 556.2 (2446), 448.6 (1973)
- Bolton 539.0 (1550), 550.2 (1582)
- Barnsley 496.6 (1226), 493.8 (1219)
- Wakefield 495.0 (1724), 441.6 (1538)
- Rossendale 492.4 (352), 463.1 (331)
- Tameside 479.0 (1085), 536.4 (1215)
- Doncaster 479.0 (1494), 546.7 (1705)
- Bassetlaw 478.5 (562), 371.2 (436)
- Bolsover 477.9 (385), 388.5 (313)
- South Staffordshire 465.2 (523), 448.3 (504)
- Hyndburn 460.2 (373), 484.9 (393)
- Preston 456.9 (654), 433.9 (621)
- Rotherham 456.7 (1212), 522.2 (1386)
- Newcastle-under-Lyme 442.7 (573), 357.7 (463)
- Manchester 439.9 (2432), 476.3 (2633)
- Dudley 438.1 (1409), 325.9 (1048)
- Derby 437.6 (1126), 364.6 (938)
- Pendle 435.3 (401), 452.7 (417)
- Leeds 429.7 (3408), 423.6 (3360)
- Calderdale 425.1 (899), 385.9 (816)
- Sandwell 424.1 (1393), 342.8 (1126)
- Stoke-on-Trent 423.6 (1086), 340.5 (873)
- Amber Valley 423.0 (542), 273.1 (350)
- Bristol 422.3 (1957), 398.8 (1848)
- Gateshead 420.2 (849), 360.3 (728)
- South Derbyshire 413.9 (444), 400.0 (429)
- Leicester 406.0 (1438), 376.0 (1332)
- Warrington 404.7 (850), 444.3 (933)
- Burnley 400.4 (356), 347.5 (309)
- Trafford 393.5 (934), 390.6 (927)
- Staffordshire Moorlands 387.1 (381), 314.9 (310)
- Stockton-on-Tees 386.6 (763), 396.8 (783)
- Redcar and Cleveland 385.7 (529), 240.6 (330)
- East Riding of Yorkshire 383.7 (1309), 289.0 (986)
- Stockport 383.4 (1125), 453.6 (1331)
- Sheffield 381.8 (2233), 410.2 (2399)
- Stafford 381.7 (524), 295.0 (405)
- Mansfield 380.6 (416), 367.8 (402)
- East Staffordshire 379.1 (454), 291.4 (349)
- Middlesbrough 374.5 (528), 285.1 (402)
- Tamworth 370.3 (284), 341.6 (262)
- Hartlepool 360.9 (338), 309.6 (290)
- Charnwood 358.4 (666), 433.7 (806)
- Sunderland 357.9 (994), 320.5 (890)
- Walsall 357.6 (1021), 335.6 (958)
- Nottingham 353.9 (1178), 398.0 (1325)
- Ribble Valley 348.2 (212), 402.4 (245)
- St. Helens 345.0 (623), 409.8 (740)
- Lichfield 344.6 (361), 253.9 (266)
- Newcastle upon Tyne 340.1 (1030), 279.0 (845)
- Scarborough 338.4 (368), 148.0 (161)
- Gedling 335.9 (396), 369.8 (436)
- County Durham 335.6 (1779), 267.1 (1416)
- Wyre 332.8 (373), 368.5 (413)
- Wolverhampton 331.9 (874), 268.5 (707)
- East Lindsey 330.2 (468), 226.5 (321)
- Ashfield 328.3 (420), 307.2 (393)
- Chesterfield 326.0 (342), 338.4 (355)
- Birmingham 325.1 (3712), 273.9 (3128)
- South Tyneside 323.2 (488), 221.9 (335)
- Blackpool 322.0 (449), 410.9 (573)
- Oadby and Wigston 321.0 (183), 347.3 (198)
- North Lincolnshire 319.8 (551), 227.5 (392)
- High Peak 317.3 (294), 304.3 (282)
- North Warwickshire 317.2 (207), 308.0 (201)
- West Lancashire 316.7 (362), 370.9 (424)
- North East Derbyshire 316.4 (321), 352.8 (358)
- Blaby 315.2 (320), 280.7 (285)
- Cannock Chase 314.6 (317), 355.3 (358)
- North Tyneside 313.6 (652), 287.6 (598)
- Knowsley 312.9 (472), 422.9 (638)
- Darlington 308.0 (329), 227.5 (243)
- South Gloucestershire 302.7 (863), 269.4 (768)
- Telford and Wrekin 301.9 (543), 239.6 (431)
- Broxtowe 301.7 (344), 305.2 (348)
- Redditch 295.6 (252), 190.0 (162)
- Lincoln 284.0 (282), 271.9 (270)
- Fylde 281.0 (227), 333.0 (269)
- Harrogate 280.4 (451), 250.0 (402)
- Solihull 277.8 (601), 236.6 (512)
- Melton 277.3 (142), 136.7 (70)
- Liverpool 272.7 (1358), 367.4 (1830)
- Rushcliffe 268.5 (320), 355.8 (424)
- Sefton 267.7 (740), 314.7 (870)
- South Ribble 267.2 (296), 364.7 (404)
- Havering 264.7 (687), 186.9 (485)
- Chorley 263.9 (312), 333.3 (394)
- Selby 263.7 (239), 225.1 (204)
- Erewash 263.5 (304), 333.7 (385)
- Swale 263.2 (395), 175.9 (264)
- Wyre Forest 262.6 (266), 164.9 (167)
- North West Leicestershire 262.5 (272), 217.2 (225)
- Carlisle 262.2 (285), 244.8 (266)
- Hambleton 259.8 (238), 193.2 (177)
- North Kesteven 258.3 (302), 155.7 (182)
- Thanet 256.5 (364), 164.2 (233)
- Luton 256.3 (546), 199.5 (425)
- Halton 252.7 (327), 299.0 (387)
- Newark and Sherwood 251.6 (308), 258.1 (316)
- Warwick 247.6 (356), 233.0 (335)
- Cheshire West and Chester 246.9 (847), 244.3 (838)
- Hinckley and Bosworth 244.0 (276), 183.8 (208)
- Northampton 238.6 (536), 167.4 (376)
- Copeland 236.1 (161), 174.5 (119)
- Nuneaton and Bedworth 235.6 (306), 201.0 (261)
- North Somerset 235.3 (506), 166.9 (359)
- Slough 232.7 (348), 194.6 (291)
- Torbay 229.7 (313), 154.8 (211)
- Redbridge 224.1 (684), 188.4 (575)
- Coventry 221.3 (822), 196.2 (729)
- Northumberland 219.0 (706), 193.8 (625)
- Bath and North East Somerset 217.8 (421), 231.8 (448)
- Portsmouth 217.8 (468), 201.9 (434)
- West Lindsey 216.4 (207), 148.4 (142)
- Worcester 216.4 (219), 150.2 (152)
- Spelthorne 216.3 (216), 137.2 (137)
- East Northamptonshire 214.8 (203), 167.1 (158)
- Cheshire East 212.9 (818), 217.4 (835)
- Bromsgrove 210.3 (210), 199.2 (199)
- Lancaster 210.2 (307), 308.8 (451)
- Shropshire 209.5 (677), 164.9 (533)
- Wirral 208.6 (676), 243.8 (790)
- Ealing 208.6 (713), 196.9 (673)
- Bournemouth, Christchurch and Poole 206.7 (817), 206.9 (818)
- Harborough 204.7 (192), 186.6 (175)
- Tower Hamlets 203.2 (660), 170.6 (554)
- Eden 200.9 (107), 167.1 (89)
- Mole Valley 200.6 (175), 170.8 (149)
- South Northamptonshire 199.0 (188), 117.5 (111)
- Craven 196.0 (112), 196.0 (112)
- Barking and Dagenham 195.4 (416), 163.9 (349)
- Dartford 193.6 (218), 120.8 (136)
- Bexley 191.7 (476), 139.8 (347)
- Derbyshire Dales 190.8 (138), 177.0 (128)
- Hillingdon 190.3 (584), 188.4 (578)
- Brentwood 188.3 (145), 214.2 (165)
- Boston 185.3 (130), 171.0 (120)
- Broxbourne 185.0 (180), 188.1 (183)
- Swindon 184.5 (410), 160.7 (357)
- Newham 184.3 (651), 171.0 (604)
- Richmondshire 182.4 (98), 176.8 (95)
- Great Yarmouth 179.2 (178), 167.1 (166)
- York 179.0 (377), 190.4 (401)
- Havant 178.3 (225), 115.7 (146)
- Gravesham 177.7 (190), 100.1 (107)
- Southampton 176.6 (446), 152.9 (386)
- South Kesteven 176.2 (251), 135.5 (193)
- Hounslow 170.9 (464), 179.0 (486)
- Wycombe 170.6 (298), 109.4 (191)
- Medway 170.5 (475), 128.5 (358)
- Brent 170.4 (562), 122.8 (405)
- Plymouth 170.2 (446), 159.1 (417)
- Wellingborough 166.9 (133), 124.2 (99)
- Watford 165.7 (160), 163.6 (158)
- Waltham Forest 164.3 (455), 166.4 (461)
- Barrow-in-Furness 164.1 (110), 277.4 (186)
- Stratford-on-Avon 163.7 (213), 143.7 (187)
- Epping Forest 163.3 (215), 159.5 (210)
- Wychavon 163.0 (211), 124.4 (161)
- Allerdale 162.6 (159), 155.5 (152)
- Rugby 160.6 (175), 148.7 (162)
- Windsor and Maidenhead 160.5 (243), 136.7 (207)
- Peterborough 159.2 (322), 137.9 (279)
- Winchester 157.0 (196), 133.8 (167)
- Aylesbury Vale 156.9 (313), 110.3 (220)
- West Oxfordshire 156.4 (173), 122.0 (135)
- Stroud 155.0 (186), 111.7 (134)
- Daventry 154.7 (133), 110.5 (95)
- Harrow 152.1 (382), 152.5 (383)
- Reading 152.1 (246), 128.0 (207)
- South Lakeland 150.4 (158), 171.3 (180)
- Gloucester 150.2 (194), 120.0 (155)
- Cherwell 150.2 (226), 138.2 (208)
- Eastleigh 149.7 (200), 152.0 (203)
- Enfield 148.3 (495), 153.7 (513)
- Hammersmith and Fulham 148.0 (274), 212.3 (393)
- Westminster 147.3 (385), 146.2 (382)
- Thurrock 146.8 (256), 153.1 (267)
- Oxford 146.3 (223), 135.8 (207)
- Runnymede 143.1 (128), 143.1 (128)
- Dover 143.1 (169), 87.2 (103)
- King's Lynn and West Norfolk 142.7 (216), 102.4 (155)
- Guildford 141.6 (211), 113.4 (169)
- South Holland 140.0 (133), 162.1 (154)
- Lambeth 138.6 (452), 150.9 (492)
- Hackney and City of London 137.9 (401), 153.7 (447)
- Exeter 137.7 (181), 128.6 (169)
- Welwyn Hatfield 137.4 (169), 117.8 (145)
- Sedgemoor 137.2 (169), 115.3 (142)
- Maidstone 136.8 (235), 108.2 (186)
- Woking 135.9 (137), 145.8 (147)
- Sutton 135.7 (280), 115.3 (238)
- Rushmoor 135.3 (128), 121.6 (115)
- Milton Keynes 134.7 (363), 108.7 (293)
- Fareham 134.2 (156), 131.6 (153)
- Merton 132.2 (273), 156.4 (323)
- South Bucks 131.3 (92), 188.5 (132)
- Kingston upon Thames 129.6 (230), 158.3 (281)
- Castle Point 129.5 (117), 70.8 (64)
- Tonbridge and Malling 129.4 (171), 90.8 (120)
- Haringey 129.2 (347), 141.1 (379)
- Barnet 129.1 (511), 137.4 (544)
- Cambridge 129.0 (161), 145.8 (182)
- Crawley 129.0 (145), 132.6 (149)
- East Devon 128.5 (188), 101.9 (149)
- Ryedale 128.2 (71), 101.1 (56)
- Basingstoke and Deane 128.0 (226), 96.8 (171)
- Kettering 127.7 (130), 89.4 (91)
- Cotswold 125.7 (113), 128.0 (115)
- Wandsworth 125.6 (414), 138.9 (458)
- Brighton and Hove 124.8 (363), 154.4 (449)
- Richmond upon Thames 124.7 (247), 151.0 (299)
- Gosport 122.6 (104), 137.9 (117)
- Bedford 121.2 (210), 104.4 (181)
- East Hampshire 121.0 (148), 87.5 (107)
- Chichester 120.5 (146), 115.6 (140)
- Greenwich 120.5 (347), 120.5 (347)
- Surrey Heath 119.8 (107), 94.1 (84)
- Stevenage 119.5 (105), 110.4 (97)
- Islington 119.2 (289), 132.4 (321)
- South Oxfordshire 118.3 (168), 105.6 (150)
- Hertsmere 118.2 (124), 144.9 (152)
- Malvern Hills 118.2 (93), 104.2 (82)
- Epsom and Ewell 117.8 (95), 150.1 (121)
- Reigate and Banstead 117.6 (175), 96.8 (144)
- North Devon 117.4 (114), 81.3 (79)
- Three Rivers 116.8 (109), 99.7 (93)
- Southend-on-Sea 114.7 (210), 87.4 (160)
- Bracknell Forest 114.2 (140), 97.1 (119)
- North Hertfordshire 113.8 (152), 109.3 (146)
- Hart 113.3 (110), 93.7 (91)
- Rutland 112.7 (45), 80.1 (32)
- Sevenoaks 112.6 (136), 96.1 (116)
- Croydon 112.5 (435), 121.3 (469)
- Waverley 111.6 (141), 128.2 (162)
- Cheltenham 110.9 (129), 95.4 (111)
- Uttlesford 109.5 (100), 70.1 (64)
- East Hertfordshire 109.5 (164), 98.8 (148)
- Wokingham 108.7 (186), 84.2 (144)
- Basildon 108.4 (203), 137.3 (257)
- Central Bedfordshire 107.7 (311), 84.5 (244)
- Broadland 105.5 (138), 60.4 (79)
- Bromley 105.0 (349), 111.0 (369)
- Dacorum 104.7 (162), 88.5 (137)
- Ipswich 104.4 (143), 81.8 (112)
- St Albans 104.4 (155), 84.9 (126)
- Colchester 104.3 (203), 101.2 (197)
- Tandridge 103.3 (91), 101.0 (89)
- Kensington and Chelsea 103.1 (161), 130.0 (203)
- Corby 102.5 (74), 78.9 (57)
- Southwark 101.9 (325), 118.2 (377)
- West Berkshire 101.6 (161), 91.5 (145)
- Forest of Dean 101.4 (88), 89.9 (78)
- Chelmsford 100.9 (180), 95.3 (170)
- Camden 100.7 (272), 107.0 (289)
- Canterbury 100.4 (166), 89.5 (148)
- Mid Sussex 100.0 (151), 86.1 (130)
- Herefordshire 99.1 (191), 84.5 (163)
- Dorset 98.8 (374), 107.0 (405)
- Lewisham 98.1 (300), 102.7 (314)
- Vale of White Horse 97.8 (133), 80.1 (109)
- Chiltern 96.9 (93), 91.7 (88)
- Elmbridge 96.5 (132), 114.0 (156)
- New Forest 95.5 (172), 95.5 (172)
- West Devon 95.0 (53), 77.1 (43)
- Babergh 93.4 (86), 101.0 (93)
- Arun 93.3 (150), 82.7 (133)
- Rochford 92.7 (81), 77.8 (68)
- Wiltshire 92.2 (461), 95.2 (476)
- Somerset West and Taunton 90.3 (140), 75.4 (117)
- Huntingdonshire 89.9 (160), 50.6 (90)
- Horsham 89.7 (129), 80.7 (116)
- South Cambridgeshire 89.3 (142), 62.9 (100)
- South Somerset 88.5 (149), 58.8 (99)
- Tewkesbury 88.4 (84), 77.9 (74)
- Test Valley 87.2 (110), 95.1 (120)
- Folkestone and Hythe 86.7 (98), 69.0 (78)
- Braintree 85.2 (130), 57.0 (87)
- Harlow 85.0 (74), 96.5 (84)
- Mendip 84.8 (98), 56.2 (65)
- Ashford 82.3 (107), 60.0 (78)
- Norwich 81.1 (114), 101.7 (143)
- Worthing 80.5 (89), 84.1 (93)
- South Norfolk 80.2 (113), 53.9 (76)
- South Hams 79.3 (69), 95.4 (83)
- Mid Devon 79.0 (65), 66.8 (55)
- Tunbridge Wells 76.6 (91), 48.9 (58)
- Fenland 72.7 (74), 83.5 (85)
- Breckland 70.7 (99), 172.9 (242)
- Teignbridge 70.1 (94), 75.3 (101)
- Lewes 69.7 (72), 80.4 (83)
- Isle of Wight 68.4 (97), 45.1 (64)
- Adur 65.3 (42), 88.6 (57)
- Eastbourne 64.6 (67), 114.7 (119)
- East Cambridgeshire 64.6 (58), 33.4 (30)
- East Suffolk 64.1 (160), 48.5 (121)
- Mid Suffolk 61.6 (64), 55.8 (58)
- Tendring 61.4 (90), 59.4 (87)
- West Suffolk 58.6 (105), 93.8 (168)
- Cornwall and Isles of Scilly 56.5 (323), 49.0 (280)
- Wealden 55.7 (90), 66.3 (107)
- Rother 54.1 (52), 48.9 (47)
- Maldon 52.4 (34), 58.5 (38)
- North Norfolk 51.5 (54), 24.8 (26)
- Torridge 51.3 (35), 55.7 (38)
- Hastings 33.5 (31), 54.0 (50)