The notion that we all must act in order to save the planet from global warming is now more pertinent than ever as NASA has released someshocking images of the Arctic.
Discover our latest podcast
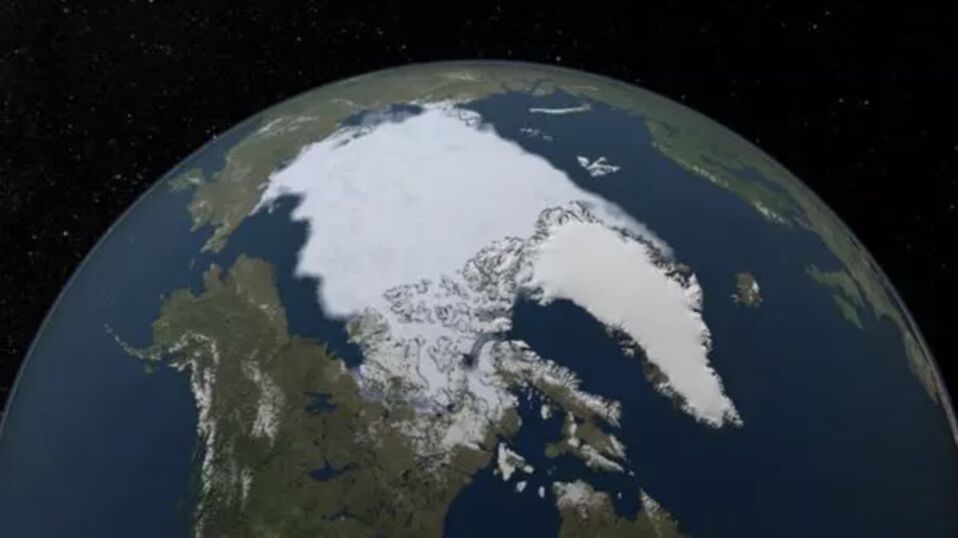
The images released as part of NASA’s Images of Change Project shows just how much of theArctic ice has been shrinking over the last few decades.
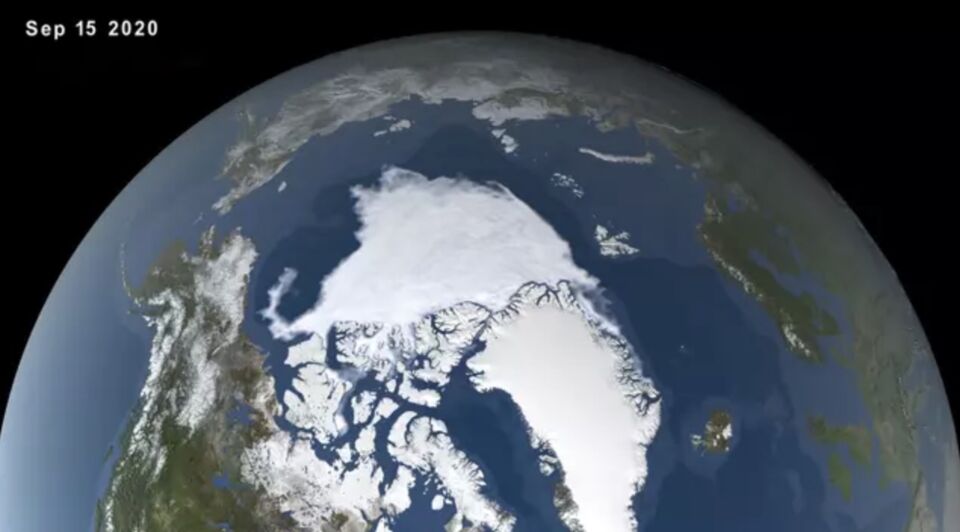
NASA’s image from 1984 shows extensive areas of Arctic ice. However, jumping to an image from September 2020, the sea ice has reached its second-lowest level on record.
The National Snow and Ice Data Centre (NSIDC) also shared some data from 2020 which showed that Arctic sea ice had been reduced to just 1.44 million square miles. NSIDC director Mark Serrese stated:
As the sea ice cover extent declines, what we're seeing is we're continuing to lose that multiyear ice. The ice is shrinking in the summer, but it's also getting thinner. You're losing extent, and you're losing the thick ice as well. It's a double whammy.
NASA also released an article on the matter, illustrating that 2020 has been one of the worst years ever in terms of melting sea ice:
In the last two decades, the minimum extent of Arctic sea ice in the summer has dropped markedly. The lowest extent on record was set in 2012, and last year's extent was tied for second - until this year's.
The article then went on to describe that 2020 brought a Siberian heatwave, raising temperatures in the arctic by 8-10 degrees and causing ice levels to decline:
The 2020 minimum extent was 958,000 square miles (2.48 million square kilometers) below the 1981-2010 average of yearly minimum extents, and 2020 is only the second time on record that the minimum extent has fallen below 1.5 million square miles (4 million square kilometers).
Images of Change
NASA’s Images of Change Project is available on the space agency’s website where viewers can see comparisons in different events such as flooding, deforestation as well as the growth of cities over periods of time ranging from days to decades. The project’s website explains:
Some of these effects are related to climate change, some are not. Some document the effects of urbanization, or the ravage of natural hazards such as fires and floods. All show our planet in a state of flux.