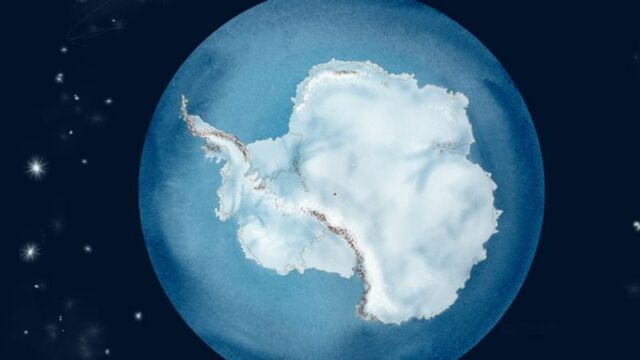
In a recent video created using data collected from NASA, the European Spatial Agency (ESA) and the scientific animators from Pixel Movers and Makers, we are provided with a detailed glimpse of how icebergs and glaciers have been melting and crumbling in Antarctica over the last 40 years.
Discover our latest podcast
In less than a minute, this short animation allows us to witness the spectacular increase in the number of these fluxes and fractures that have taken place over the last two decades.
An increasing frequency
‘We’ve been looking forward to making this!’ exclaimed Kevin Pluck and Marlo Garnsworthy from Pixel Movers and Makers in the tweet in which they also released their video. This collection of forty-years worth of data (collected between 1976 and 2017), that has been compiled and compressed into less than a minute’s worth of footage, is more eloquent and telling than a speech could ever be.
This video has allowed us to witness the uncontrollable frequency in which the ice has been broken down and melted over recent years. The video especially focuses on the breakdown of the Larsen Ice Shelf in 2002 and the journey made by the B-15 iceberg, the largest iceberg ever recorded (11,000 kilometres squared), which detached itself from the Ross Ice Shelf in 2000.
‘I was surprised (and yet not) to see an apparent uptick in iceberg flux in recent years,’ explained Garnsworthy. Over the last 40 years of evolution, 40% of the total ice loss occurred between 2012 and 2017.
From the Antarctic to the oceans
Among the data used to create this video, you can also find data collected from databases and studies carried out on icebergs in Antarctica that was carried out by Brigham Young University. These studies obtained their results using six satellites equipped with scatterometer instruments which are used to track objects on the Earth’s surface.
The icebergs shown in this animation are big enough to be detected by these devices. When they became detached, icebergs normally spin counterclockwise around Antarctica before heading into ‘Iceberg Alley’ and getting caught up in the Antarctic Circumpolar Current.
From then, they are left to fend for themselves in the ocean and end up melting, consequently resulting in the water levels rising. Understanding the mechanisms that lead to this massive loss of ice is crucial if we want to prevent the numerous coastal towns from finding themselves underwater in ten years time.